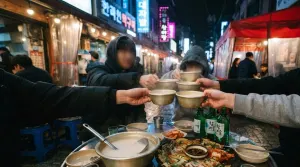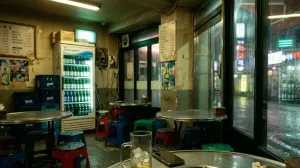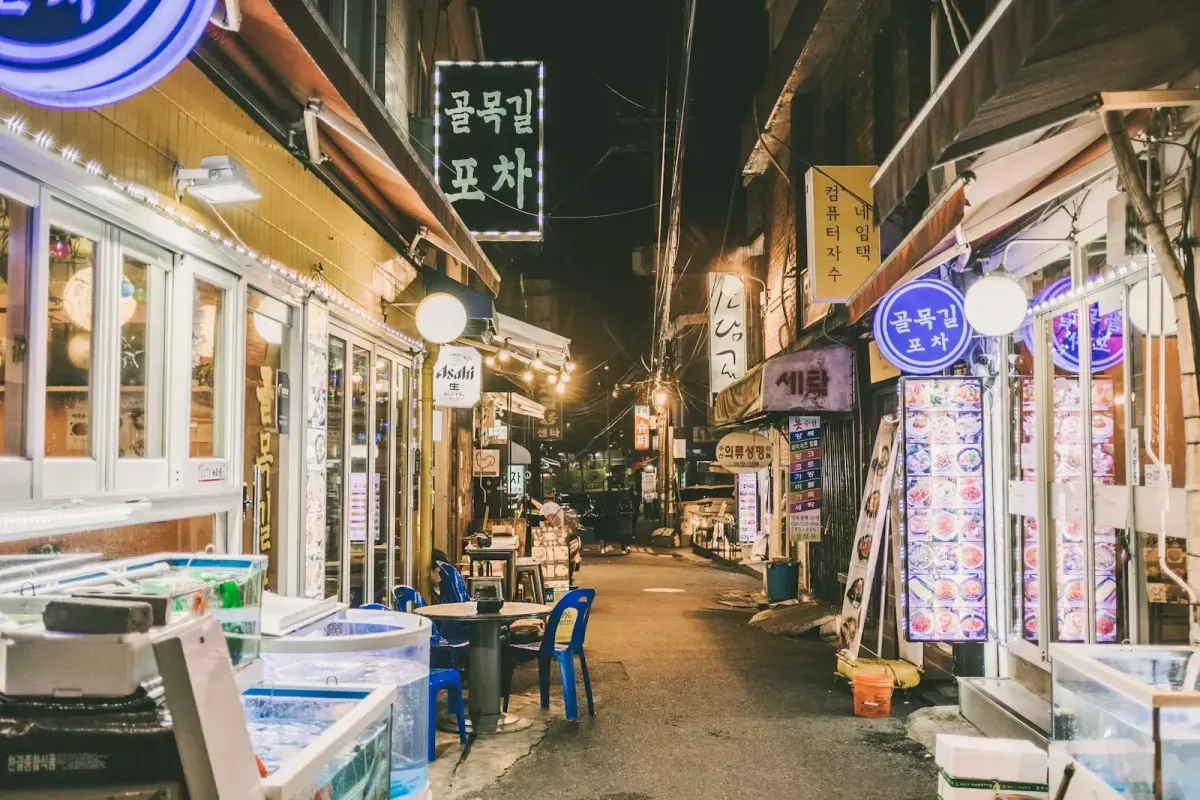
Forty-four percent of the people who answered chose Itaewon. Twenty-eight percent go out less than once a month. Both numbers say something real about who Seoul’s scene is serving, and both should change how a promoter here plans the next year. The ten headline statistics are collected on the Seoul nightlife statistics page, formatted for reference and citation.
Why run a survey at all? As someone involved in the marketing and branding side of nightlife, I wanted to answer my own questions with data instead of hunches, and to give other venues and businesses something they could use.
한국어 요약
서울 나이트라이프 리포트, 343명이 답한 서울 클럽 신의 지금
제가 2024년 말 클럽 SNS 채널과 입소문으로 진행한 설문에 343명이 답했고, 이 글은 그 결과와 제 해석을 담았습니다.
- 선호 지역: 첫 번째 선택은 이태원 44%, 해방촌 23%, 홍대 19%, 강남 9%, 을지로 5% 순이었습니다.
- 외출 빈도: 한 달에 한 번꼴이 41%, 한 달에 한 번 미만이 28%였고, 매주 나가는 사람은 9%에 그쳤습니다.
- 원하는 변화: 로컬 DJ 섭외를 늘려 달라는 요청이 47%로 가장 많았고, 이태원 밖의 더 좋은 사운드 38%, 더 이른 시작 시간 33%가 뒤를 이었습니다.
- 숫자 밖의 변화: 사람들은 동네를 먼저 정하지 않고 특정 공간의 특정 공연을 골라 가며, 일행 규모도 작아졌습니다.
한 번 나갈 때 입장료, 술, 귀가 택시비까지 대략 4만 원에서 11만 5천 원, 보통 7만 원 안팎을 쓴다고 답했습니다. 스스로 참여한 표본이라 서울 전체가 아니라 클럽을 즐기는 핵심 관객의 모습으로 읽어 주시기 바랍니다.
잘못된 정보나 바뀐 날짜를 발견하셨나요? 연락 주시면 확인 후 바로 고치겠습니다. 현장에서 보고 들은 이야기도 언제나 환영합니다.
How the Survey Was Run
In late 2024 this site ran a survey on Seoul nightlife, distributed through club social media channels and by word of mouth in the bilingual community that overlaps the city’s club scene. 343 people responded.
The self-selection is the obvious weakness and it’s also the point. People who fill in a nightlife survey are people who care about nightlife. That makes this useless as a picture of the general population and useful as a picture of the audience the venues on the club map depend on, described in its own words rather than in a promoter’s assumptions about it.
Where They Go
Two findings hide in that list.
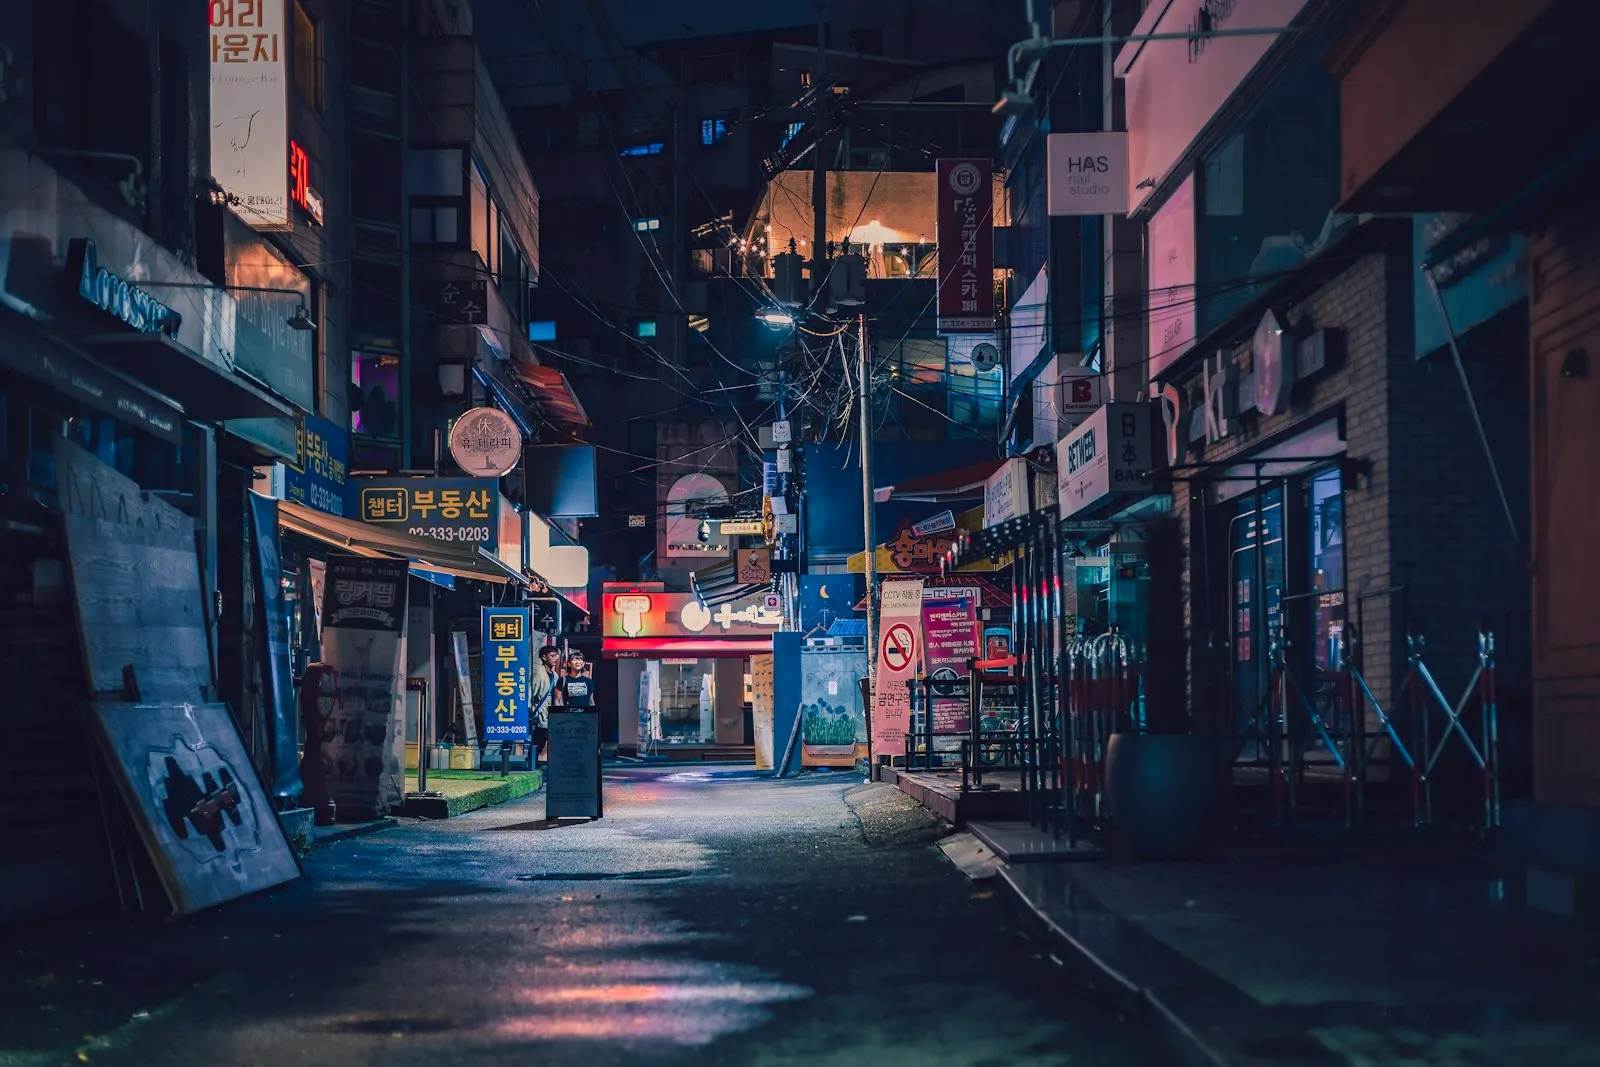
First, Itaewon and Haebangchon together take two-thirds of this community’s loyalty, which makes the district’s recovery a demographic fact rather than nostalgia.
Second, Gangnam sits at 9 percent among engaged clubbers, behind a neighbourhood with no marquee venue. That’s the audience-side evidence for the megaclub model’s collapse. The spectacle economy lost this crowd.
I’d add one caution about Euljiro at 5 percent. A survey that asks for a favourite district under-reads a neighbourhood people go to for one specific bar rather than for the area itself. Euljiro is almost certainly larger in visits than it looks here in loyalty.
How Often, and for How Much
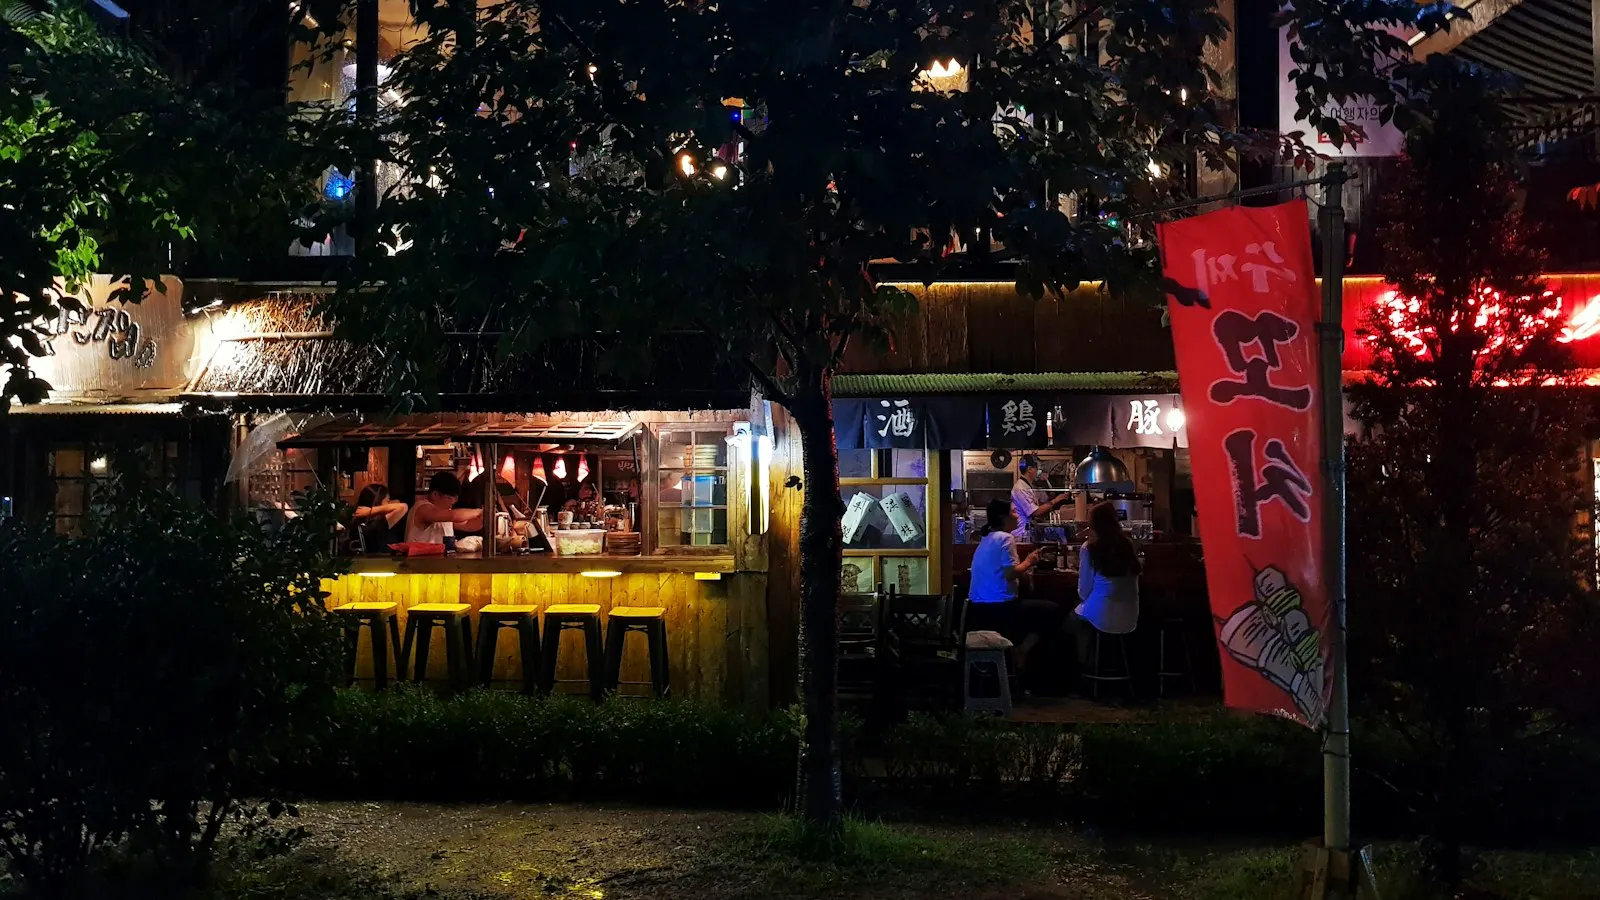
Frequency was the sobering finding. The committed core that venues programme for is roughly one person in ten even inside the committed community, which is the pattern sitting underneath the post-COVID behaviour shift and the rise of earlier, lighter formats.
On money, the most common drink budget was 25,000 to 50,000 won a night (34.2 percent), which puts the typical drinker at about 45,000 won. Add the door, free or under 20,000 won for 92.5 percent of people, and a late taxi home, and a typical full night comes to roughly 70,000 won, about CAD $67, with most nights landing between 40,000 and 115,000 won. It prices a monthly habit as a real but bounded luxury, and it explains why cheap-entry rooms hold loyalty better than rooms that need you to commit at the door.
The taxi home fits a wider Seoul pattern. A 2023 Seoul Institute (서울연구원) report, reworking Korea Tourism Organization survey data from 2022, found that 64.2 percent of night tourism experiences in Seoul were same-day trips, against 38.1 percent nationally, with overnight stays well below the national average.
A Night Out in Seoul, Itemised
From the survey of 343 club goers, late 2024
서울에서 하룻밤, 얼마나 쓸까
Typical night: about ₩70,000Roughly CAD $67. Track runs from ₩0 to ₩120,000. Spend was reported in price bands from memory, so treat the upper end as the more honest one.
Home the same nightShare of night tourism experiences that were same day trips, from the Seoul Institute, 2023, using 2022 data. Track runs from 0 to 100 percent.
Won per US dollar. The survey asked for local bookings as the won slid. By June 2026 it was the weakest since March 2009, so every imported headliner cost more. Track runs from ₩0 to ₩1,600.
₩5 trillion a year in extra night spending is Seoul's target within five years. Each Moonlight Yajang district gets up to ₩2 billion.
Sources: Korea JoongAng Daily · Korea Times · Financial News · Money Today
What They Asked For
The requests were unambiguous, and the top one stands out: the audience asked for local bookings over imported headliners, by a clear margin, just as the won’s slide in December 2024 began making imported headliners far more expensive.
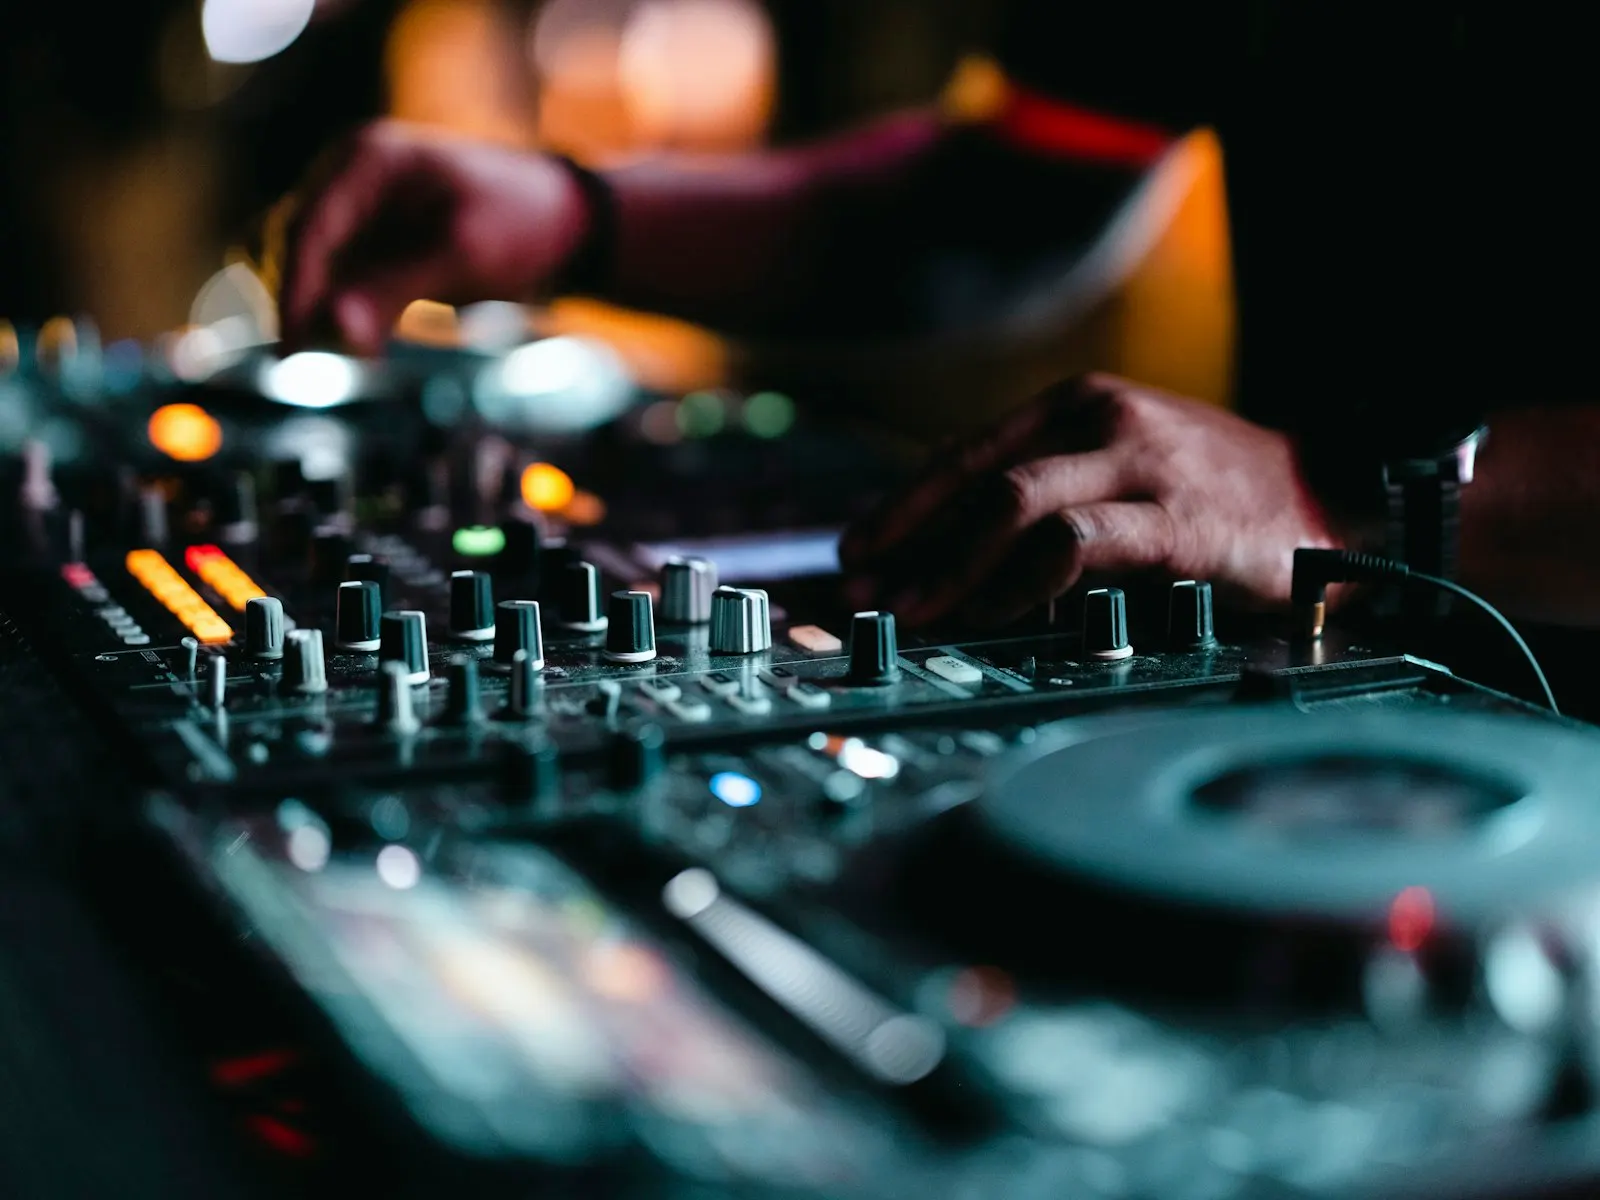
Every one of those three has since moved in the direction asked for. Venues started handing off-nights to local promoter crews, the domestic selector generation started getting real bookings, and the daytime calendar filled up. I don’t claim the survey caused any of that. I claim the audience saw it coming, which is the entire argument for asking them.
What the Survey Numbers Miss
Surveys capture what people are willing to say about their habits. Having stood behind the decks through the years this data covers, here’s what I saw that a questionnaire won’t pick up.
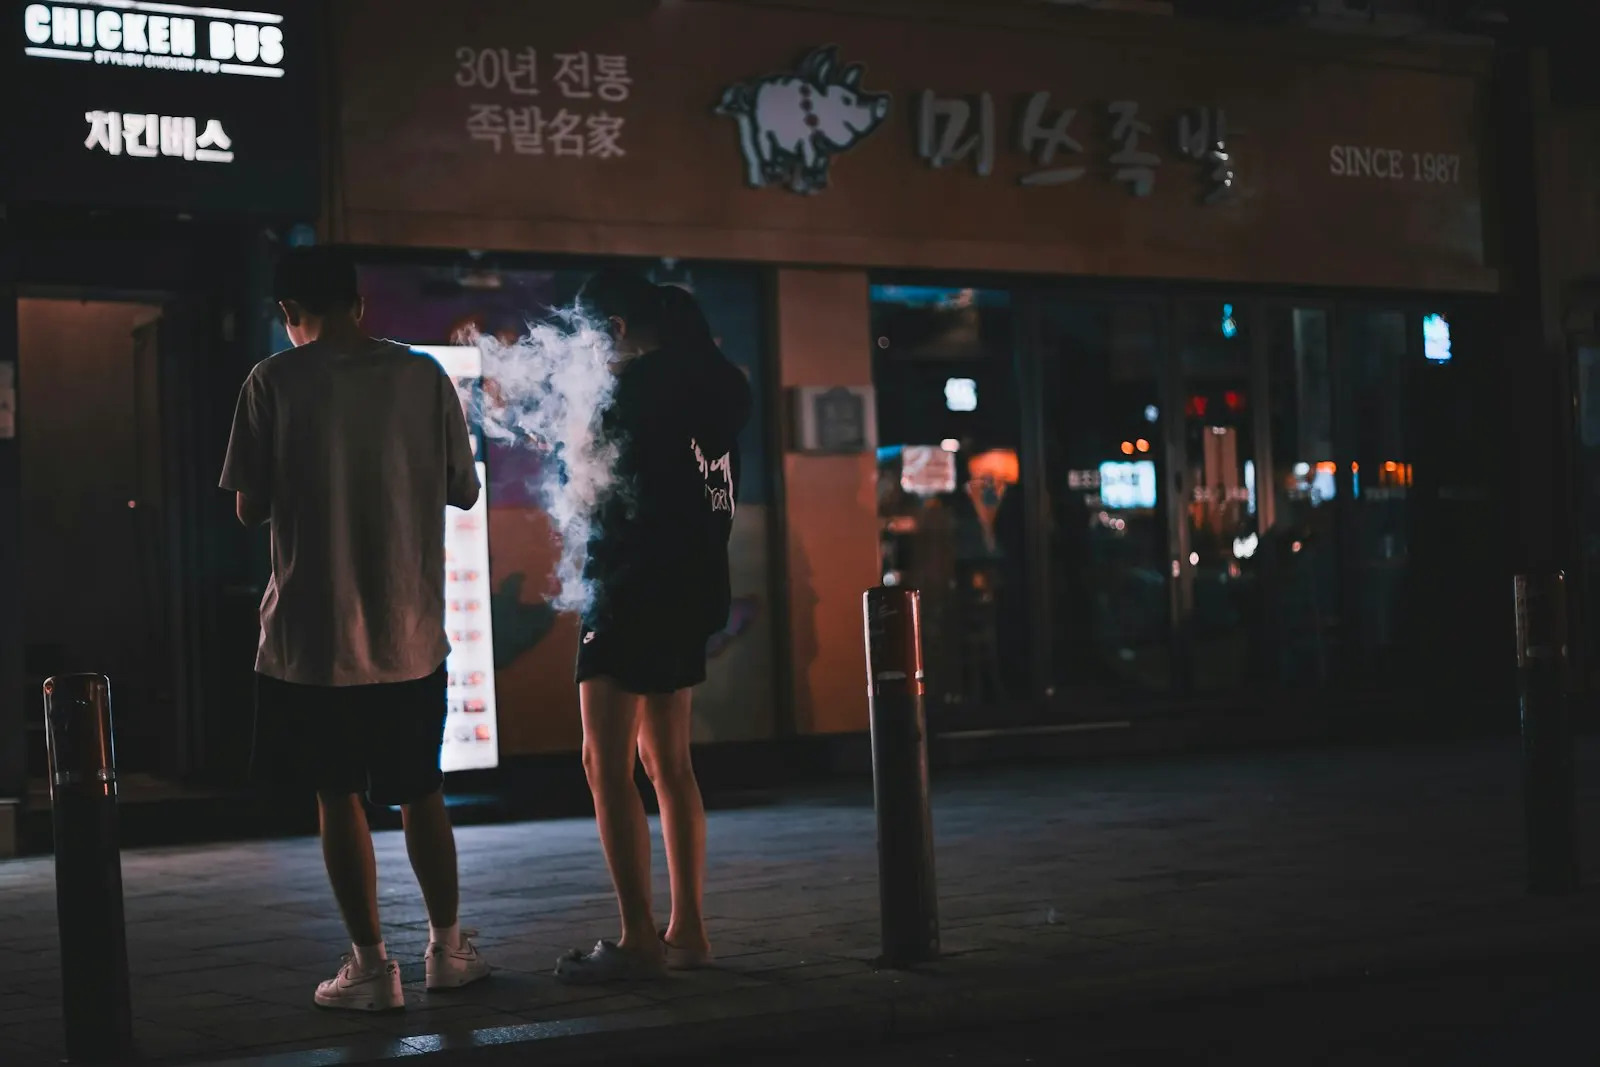
People didn’t stop going out. They stopped going out speculatively. The old pattern was to head to a district and find a night. The current pattern is to decide on one specific room, for one specific booking, and to leave when it finishes. That’s a smaller number of visits with a higher intention behind each one, and it’s brutal on venues that relied on passing trade.
The night got shorter at the front, not the back. Arrival times moved later while closing times held, which compresses the paying window and makes the earlier hours financially dead. Every operator I know has had the conversation about whether to open at all before midnight.
The wider city runs on an even earlier clock. In a Seoul survey of 1,000 residents in July 2026, cited by the city’s first night economy chief adviser, Lee Ji-hyun, in a Financial News (파이낸셜뉴스) interview, 92 percent of leisure after 6pm happened between 6 and 9pm, and 63 percent said they would do more at night if conditions improved. City card data in the same interview puts residents’ spending between 5pm and 6am at about 310.8 billion won a day.
Group sizes shrank. Fours and pairs where there used to be eights. That changes what a room needs to look like, and it’s part of why the small-room format keeps winning here.
Who This Actually Hurt
The pain wasn’t evenly distributed, and pretending otherwise flatters the recovery.
Mid-sized venues took it worst. Too big to run on forty committed regulars, too small to sell the table packages that carry the megaclubs. That middle tier is where the closures concentrated and it hasn’t come back.
New DJs lost the on-ramp. Fewer weeknights means fewer low-stakes slots, and low-stakes slots are where people used to learn. The generation that would have been picking up residencies has fewer rooms to be bad in, and that carries a delayed cost the numbers won’t show for another few years.
The winners were the very small and the very corporate. A forty-capacity room with a devoted crowd survives on almost nothing. A table-service operation sells certainty. The interesting middle is the casualty.
Where I Think This Data Is Weakest
A report that only lists its strengths is marketing. Three things I’d fix if I were designing this again.
- It asked for a favourite district, not a list of visits. That flatters neighbourhoods people are loyal to and penalises neighbourhoods people simply turn up in. Euljiro is the obvious victim.
- Distribution through club channels finds people already attached to clubs. The person who stopped going out entirely in 2020 and never restarted is the single most interesting respondent I didn’t reach, and their absence makes the frequency numbers look healthier than the city is.
- Spend was self-reported from memory. People underestimate what a night costs them, reliably and in the same direction, so treat the upper band as the more honest one.
What I Would Watch Next
Whether the daytime and early-evening formats stick, because they’re the biggest structural change of the period rather than a stopgap. Whether the mid-sized room comes back, or whether the scene settles permanently into small rooms plus big rooms with nothing in between. And whether the districts that got cheap during the downturn hold their new venues, because that’s where the next five years of programming will come from.
The city has started to act on the same trends. A Seoul Metropolitan Government press release of 15 July 2026 proposed night economy co-prosperity zones with longer outdoor trading hours and 25 “Seoul Moonlight Yajang” (서울 달빛야장, Seoul dalbit yajang) street dining areas by 2028, noting that closures of noraebang and small bars are rising while demand for culture and wellness at night grows.
The numbers above are the best data I have, and they’re ageing. Nothing in them has been contradicted by what I’ve watched happen since, which is part of why I’ve left them standing rather than quietly retiring the post. The next round of fieldwork hasn’t run yet. When it does, this page is where it will land, and the 2024 figures will stay visible underneath it so the comparison is possible.
What comes next. There’s so much more I’d ask. The plan is to run the survey again, compare the results across two years, and add more questions on lifestyle and behaviour, so the next report can show why things changed as well as what changed.
Go Deeper: Seoul’s Night Economy
The city is now making policy about the same nights this survey describes. These are the best places to follow it.
- Herald Business: Seoul pushes nighttime economy zones: the English summary of the city’s July 2026 plan for longer hours and late transit.
- Munhwa Ilbo on Seoul’s first night economy special adviser (Korean): who now leads night policy at City Hall.
- VibeLab: the Amsterdam based research group, co-founded by a former night mayor, behind much of the world’s nightlife policy work.
- Global Nighttime Recovery Plan, chapter 5: how cities from Amsterdam to Montreal govern the night, in a free PDF.
- Seoul Metropolitan Government on owl buses: the late night routes that decide how much of that 70,000 won goes on a taxi.
FAQ
How did Seoul nightlife change after 2020?
Attendance became intentional rather than exploratory. People now choose a specific room for a specific booking instead of heading to a district to find a night. Arrival times moved later while closing times held, which compressed the profitable window, and group sizes shrank from eights to fours and pairs. The effect fell hardest on mid-sized venues, which are too large to survive on regulars and too small to sell table packages.
Are Seoul clubs recovering?
Unevenly. Very small rooms with committed crowds and large table-service operations have both proved resilient, while the mid-sized tier where most closures happened hasn’t returned. Calling it a recovery without naming which tier you mean overstates it.
Which Seoul district is most popular for nightlife?
Among the 343 people surveyed, Itaewon at 44 percent, then Haebangchon at 23, Hongdae at 19, Gangnam at 9 and Euljiro at 5. That’s a committed club-going sample rather than the general public, so read it as where the scene’s core audience is loyal rather than where the most people go.
How much does a night out in Seoul cost?
About 70,000 won, around CAD $67, for a typical full night. The most common drink budget is 25,000 to 50,000 won (34.2 percent of respondents), most doors are free or under 20,000 won, and a late taxi across town adds about 15,000 to 20,000 won. Most nights land between 40,000 and 115,000 won. Spend was reported in price bands, so treat these as estimates.
Do Seoul clubbers want international headliners?
Not as the priority. 47 percent asked for more local DJ bookings over imported headliners, the single most requested change in the survey, and it was asked for just as the exchange rate made booking international acts difficult for Korean promoters.
Can I cite these numbers?
Yes, with attribution to The DJ Diaries and the note that fieldwork was late 2024 with 343 self-selecting respondents. The figures are laid out for reference on the statistics page. If you’re writing something that depends on them, say the sample size out loud. It’s the number that tells your reader how much weight to put on the rest.
The Fuller Picture
This page is the evidence. The argument around it, and the parts of the story the survey doesn’t reach, are spread across a few other pieces.
Two more are being written: one on the economics of running a room here, and one on why touring headliners stopped coming. Both land in October and this section will carry them when they do.
Further Reading
- Wikipedia: Itaewon, the district most respondents chose
- Wikipedia: Hongdae and its student and indie nightlife
- Wikipedia: Gangnam District and its large club venues
- Wikipedia: the COVID-19 pandemic in South Korea and its effect on venues
- Seoul Metropolitan Government: official English portal for the city
- The Seoul Institute (서울연구원), Cool Night Tourism City Seoul, 2023 (PDF)
- Financial News (파이낸셜뉴스): interview with Seoul’s first night economy chief adviser (20 September 2026)
- Seoul Metropolitan Government: night economy co-prosperity zones and Seoul Moonlight Yajang, press release (15 July 2026)
Written from Seoul, by someone who has been in the booth for more than twenty years. More on the site, or book a DJ.
Stay in the Loop
New writing on DJ culture, electronic music, and the Seoul underground, delivered when it matters.
More From The DJ Diaries
Play with the history
Four tools built from the same research as this site.